Handling IOT data with MQTT, Telegraf, InfluxDB and Grafana
IOT produce a lot of data. This tutorial will explain how to move, format, store and explore all this data with state of the art technologies.
物联网产生大量数据。本教程将解释如何使用最先进的技术移动、格式化、存储和探索所有这些数据。
The stack we are going to use is MQTT, Telegraf, InfluxDB and Grafana. In top of that, everything will be contenerised thanks to Docker. Below is a little architecture schema that show whare we are going to build.
我们将要使用的堆栈是 MQTT、Telegraf、InfluxDB 和 Grafana。最重要的是,多亏了 Docker,一切都将得到控制。下面是一个小小的架构架构,显示了我们将要构建的内容。
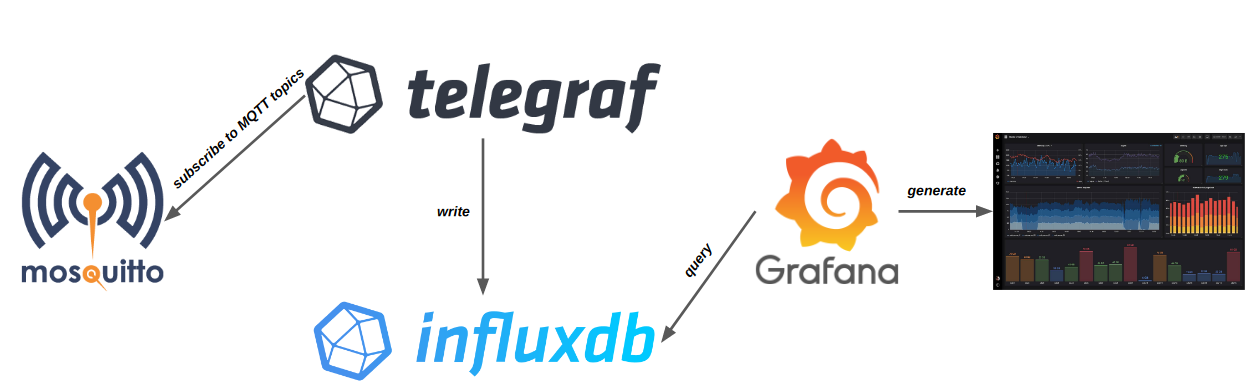
The resulting tech stack, all of that running inside Docker.
由此产生的技术堆栈,所有这些都在 Docker 中运行。
Note, this tutorial will simply explain how to setup this tech stack. It will not explain how each software work in depth. Also, all the code for this tutorial can be found on Github Gist.
请注意,本教程将简单地解释如何设置此技术堆栈。它不会解释每个软件如何深入工作。此外,本教程的所有代码都可以在 Github Gist 上找到。
First step, Docker and Docker Compose
第一步,Docker 和 Docker Compose
The current industry trend is contenerise everything. IOT is not an exception, and as such we will setup this complete stack with containers.
目前的行业趋势是包容一切。物联网也不例外,因此我们将使用容器设置这个完整的堆栈。
Docker is the industry standard when it comes to containers. Docker Compose is a tool to manage multiple containers. To follow up with this tutorial you will need Docker and Docker Compose installed.
Docker 是容器的行业标准。Docker Compose 是一个用于管理多个容器的工具。要继续学习本教程,您需要安装 Docker 和 Docker Compose。
-
Install Docker: https://docs.docker.com/engine/install/
安装 Docker:https://docs.docker.com/engine/install/ -
Install Docker-Compose: https://docs.docker.com/compose/install/
安装 Docker-Compose:https://docs.docker.com/compose/install/
For this tutorial we will need to work with multiples container exchanging data. We will need them to be on the same Docker network. Let』s create a very simple one named iot:
在本教程中,我们将需要使用多个容器交换数据。我们需要它们在同一个 Docker 网络上。让我们创建一个非常简单的名为 iot 的:
docker network create iotGetting started with MQTT
MQTT 入门
MQTT which means Message Queuing Telemetry Transport is an open ISO standard, publish/subscribe network protocol. It is widely used in IOT for it』s very low network footprint and simplicity of usage.
MQTT 的意思是消息队列遥测传输,是一种开放的 ISO 标准、发布/订阅网络协议。它被广泛用于物联网,因为它的网络占用空间非常小,使用简单。
For this tutorial I choose Eclipse Mosquitto as an implement of the MQTT protocol since it』s open source and have an easy to use Docker image. Let』s pull the official Docker image located at https://hub.docker.com/_/eclipse-mosquitto
在本教程中,我选择 Eclipse Mosquitto 作为 MQTT 协议的实现,因为它是开源的,并且具有易于使用的 Docker 映像。让我们拉取位于 https://hub.docker.com/_/eclipse-mosquitto 的官方 Docker 镜像
docker pull eclipse-mosquittoNow, lets try to run the container based on this image:
现在,让我们尝试根据此映像运行容器:
docker run -it --rm \
  --network=iot \
  -p 1883:1883 -p 9001:9001 \
  --name mosquitto \
  eclipse-mosquitto
This command will tell Docker to run the eclipse-mosquitto image in an interactive way (-it) and forward the ports 1883 and 9001 to the one on the container, since Mosquitto require them to work. We also ask Docker to auto remove (-rm) the container once it has terminate. The container will be started on the iot network thanks to the (-network) option. It also tell Docker to name this container mosquitto. Once run, the Mosquitto server should tell you that it is now listening on port 1883.
此命令将告诉 Docker 以交互方式 (-it) 运行 eclipse-mosquitto 映像,并将端口 1883 和 9001 转发到容器上的端口,因为 Mosquitto 要求它们工作。我们还要求 Docker 在容器终止后自动删除 (-rm)。由于 (-network) 选项,容器将在物联网网络上启动。它还告诉 Docker 将这个容器命名为 mosquitto。运行后,Mosquitto 服务器应该告诉您它现在正在侦听端口 1883。
Let』s try to send a message to the Mosquitto server. For this we are going to use the mosquitto_pub command already installed in the Docker container. Execute the following command in another terminal:
让我们尝试向 Mosquitto 服务器发送消息。为此,我们将使用 Docker 容器中已安装的 mosquitto_pub 命令。在另一个终端中执行以下命令:
docker container exec mosquitto mosquitto_pub \
  -t 'bedroom/temperature' \
  -m '20'
This command ask the previously started container to execute the mosquitto_pub command on the topic (-t) bedroom/temperature to send the message (-m) 20. On the server you should see that a client connected and disconnected.
此命令要求先前启动的容器对主题 (-t) bedroom/temperature 执行 mosquitto_pub 命令以发送消息 (-m) 20。在服务器上,您应该看到客户端已连接和断开连接。
An advantage of MQTT is to have the ability to send any kind of format of data as a message. It means that we could send JSON:
MQTT 的一个优点是能够将任何类型的数据作为消息发送。这意味着我们可以发送 JSON:
docker container exec mosquitto mosquitto_pub \
  -t 'bedroom/sensors' \
  -m '{"degrees": 20, "powerConsumption": 2}'
We have now setup our MQTT server and a way to send IOT data. Keep the Mosquitto server running for now and let』s see how to store MQTT data passing trough.
我们现在已经设置了 MQTT 服务器和一种发送 IOT 数据的方法。暂时保持 Mosquitto 服务器运行,让我们看看如何存储传递低谷的 MQTT 数据。
Introducting InfluxDB at the right time
在正确的时间引入 InfluxDB
InfluxDB is a time series database. It means, that every data stored by this database will have a time field. InfluxDB is open source and very often used in IOT to store telemetry. It』s very powerfull and can handle a large amount of data. InfluxDB main use case is for handling large amount of timestamped data. Ideal for IOT!
InfluxDB 是一个时序数据库。这意味着,该数据库存储的每个数据都将有一个时间字段。InfluxDB 是开源的,经常在 IOT 中用于存储遥测数据。它非常强大,可以处理大量数据。InfluxDB 的主要使用案例是处理大量带时间戳的数据。物联网的理想选择!
InfluxDB also have an official Docker image that we are going to use https://hub.docker.com/_/influxdb. Let』s pull it:
InfluxDB 还有一个官方的 Docker 镜像,我们将 https://hub.docker.com/_/influxdb 使用它。让我们拉动它:
docker pull influxdb:1.8As we can find on the documentation, let』s run the image:
正如我们在文档中找到的,让我们运行映像:
docker run \
  --network=iot \
  -v $PWD/influxdb-data:/var/lib/influxdb \
  --name influxdb \
  influxdb
This command will run the influxdb Docker image in a new container. This container will run on the same network as the Mosquitto one (iot) and will have it』s port (-p) 8086 mapped to the one on your OS. This port is required by InfluxDB for HTTP API access. Then, to make InfluxDB data persistent between InfluxDB images run we bind an OS volume to the one in your container (-v). The $PWD is the path on your OS, so in this cas your current working directory. Finally, we name this container influxdb.
此命令将在新容器中运行 influxdb Docker 映像。此容器将与 Mosquitto one (iot) 在同一网络上运行,并将其端口 (-p) 8086 映射到操作系统上的端口。InfluxDB 需要此端口才能访问 HTTP API。然后,为了使 InfluxDB 数据在 InfluxDB 映像之间持久化,我们将操作系统卷绑定到容器 (-v) 中的卷。$PWD是操作系统上的路径,因此在此 cas 中是您当前的工作目录。最后,我们将此容器命名为 influxdb。
The Telegraf agent Telegraf 代理
We are going to see how to pass our data from MQTT to InfluxDB. This is a job perfectly suited for Telegraf. Telegraph is an open source, plugin-driven agent. It connect to multiple inputs and write to multiple output. It can apply data transformations to it』s input.
我们将了解如何将数据从 MQTT 传递到 InfluxDB。这是一项非常适合 Telegraf 的工作。Telegraph 是一个开源的、插件驱动的代理。它连接到多个输入并写入多个输出。它可以将数据转换应用于其输入。
Telegraf have an official Docker image here: https://hub.docker.com/_/telegraf. Let』s first pull it:
Telegraf 在这里有一个官方的 Docker 映像:https://hub.docker.com/_/telegraf。我们先来拉一下:
docker pull telegrafTelegraph can handle many different input and output plugin. For our use case we are going to see the MQTT input plugin and the InfluxDB and file output plugin. You can find the list of all Telegraph plugins here.
Telegraph 可以处理许多不同的输入和输出插件。对于我们的用例,我们将看到 MQTT 输入插件和 InfluxDB 和文件输出插件。您可以在此处找到所有 Telegraph 插件的列表。
To start with the Telegraf configuration we have to create a telegraf.conf file. We can either start from scratch or generate a big one with the following command:
要从 Telegraf 配置开始,我们必须创建一个 telegraf.conf 文件。我们可以从头开始,也可以使用以下命令生成一个大的:
docker run --rm telegraf telegraf config > telegraf.confThis command ask Telegraf to output it』s config to the telegraf.conf file on the host OS. Now we are going to edit this file to add input and output plugins. Open the telegraf.conf file, don』t be afraid of it』s really big size. All available plugins config are commented inside the file.
此命令要求 Telegrafto 将其配置输出到主机操作系统上的 telegraf.conf 文件。现在我们将编辑此文件以添加输入和输出插件。打开telegraf.conf文件,不要害怕它真的很大。所有可用的插件配置都在文件中进行了注释。
But for this tutorial we will start from a blank telegraf.conf file, for learning purpose. So, delete the generated file and create a new empty one. Paste the following, minimal, code inside:
但是在本教程中,出于学习目的,我们将从一个空白的 telegraf.conf 文件开始。因此,删除生成的文件并创建一个新的空文件。将以下最小代码粘贴到其中:
[[outputs.influxdb]]
  urls = ["http://influxdb:8086"]

[[outputs.file]]
  files = ["stdout", "/tmp/metrics.out"]

[[inputs.mqtt_consumer]]
  servers = ["tcp://mosquitto:1883"]
  topics = [
    "bedroom/#"
  ]
This file enable two new ouputs, the InfluxDB and file one. We pass an array of urls InfluxDB should connect to. The file ouput will write everything that Telegraf receive by it』s input to both stdout and a file located at /tmp/metrics.out. Writing to both this location will help debuging.
此文件启用两个新的输出,即 InfluxDB 和文件输出。我们传递 InfluxDB 应连接到的 url 数组。文件输出会将 Telegraf 通过其输入接收到的所有内容写入 stdout 和位于 /tmp/metrics.out 的文件。写入这两个位置将有助于调试。
Let』s talk about the input, the mqtt_consummer, we first specify to Telegraf how to connect to the Mosquitto server. Then, we also tell Telegraf to which topics it must subscribe, in this case, every MQTT topics under bedroom.
让我们来谈谈输入,mqtt_consummer,我们首先向 Telegraf 指定如何连接到 Mosquitto 服务器。然后,我们还告诉 Telegraf 它必须订阅哪些主题,在本例中,卧室下的每个 MQTT 主题。
Since the Telegraf container will run on the same Docker network as InfluxDB and Mosquitto we can use their container name instead of their container ip in their adress.
由于 Telegraf 容器将与 InfluxDB 和 Mosquitto 在同一个 Docker 网络上运行,因此我们可以在它们的地址中使用它们的容器名称而不是它们的容器 ip。
Let』s test that everything is working. If you closed your Mosquitto or InfluxDB container restart them using previously used command. We are now going to first start the Telegraf container:
让我们测试一下一切是否正常。如果您关闭了 Mosquitto 或 InfluxDB 容器,请使用以前使用的命令重新启动它们。现在,我们将首先启动 Telegraf 容器:
docker run --rm \
  --network=iot \
  -v $PWD/telegraf.conf:/etc/telegraf/telegraf.conf:ro \
  --name telegraf \
  telegraf
This will start Telegraf mouting the telegraf.conf file from your host system to the container. If everything is OK, Telegraf logs should tell you that it has loaded an mqtt_consummer input and a file and influxdb output. It also should that it has connected to the MQTT on tcp://mosquitto:1883. Now that our setup is complete let』s send a MQTT message and see that it works. From a new terminal send a MQTT message:
这将启动 Telegraf 将 telegraf.conf 文件从主机系统发送到容器。如果一切正常,Telegraf 日志应该告诉您它已加载mqtt_consummer输入以及文件和 influxdb 输出。它还应该已连接到 tcp://mosquitto:1883 上的 MQTT。现在我们的设置已经完成,让我们发送一条 MQTT 消息,看看它是否有效。从新终端发送 MQTT 消息:
docker container exec mosquitto mosquitto_pub \
  -t 'bedroom/temperature' \
  -m 'bedroom_temperature celsius=20'
The message (-m) must match the influx format, which is:
消息 (-m) 必须与流入格式匹配,即:
measure_name field1=value1, field2=value2With measure_name being something to identify your measure. After running the previous Docker command you see that Telegraf has printed some log:
measure_name是确定您的措施的东西。运行上一个 Docker 命令后,您会看到 Telegraf 已打印了一些日志:
bedroom_temperature,host=0c4fc13ca77a,topic=bedroom/temperature celsius=20 1606126188330968846This means that the data was correctly writed to InfluxDB. To be sure about that we are going to connect to InfluxDB and see it』s measures. First, let』s get into the container and run the influx command:
这意味着数据已正确写入 InfluxDB。为了确定这一点,我们将连接到 InfluxDB 并查看它的措施。首先,让我们进入容器并运行 influx 命令:
docker exec -it influxdb influxWe are now in the InfluxDB shell. We first need to tell InfluxDB which database to use. In our case, a default one was created by Telegraf, let』s use it. In the InfluxDB shell write:
我们现在位于 InfluxDB shell 中。我们首先需要告诉 InfluxDB 使用哪个数据库。在我们的例子中,一个默认的是由 Telegraf 创建的,让我们使用它。在 InfluxDB shell 中,写入:
use telegrafNow, let』s see all the series inside the database. In InfluxDB a serie is a logical group of data defined by shared measurement, tag set, and field key. Let』s see the one in your database:
现在,让我们看看数据库中的所有系列。在 InfluxDB 中,序列是由共享度量、标签集和字段键定义的逻辑数据组。让我们看看数据库中的那个:
show seriesThe previous query will print all the data in your telegraf database. You should now see the data you have sent trough MQTT. Since our data is now stocked, let』s explore it in Grafana!
上一个查询将打印 telegraf 数据库中的所有数据。您现在应该看到通过 MQTT 发送的数据。既然我们的数据现在已经储存好了,让我们在 Grafana 中探索它吧!
Explore our data with Grafana
使用 Grafana 探索我们的数据
Grafana is a web app tool to query, visualize and create alerts about metrics, no matter where they are stored. It help create easy to use dashboard. It』s used by big tech companies such as Ebay, Paypal, Intel, etc. Grafana can run inside a Docker container. Let』s pull the Docker image located at https://hub.docker.com/r/grafana/grafana/
Grafana 是一个 Web 应用程序工具,用于查询、可视化和创建有关指标的警报,无论它们存储在何处。它有助于创建易于使用的仪表板。它被Ebay,PayPal,英特尔等大型科技公司使用。Grafana 可以在 Docker 容器内运行。让我们拉取位于 https://hub.docker.com/r/grafana/grafana/ 的 Docker 映像
docker pull grafana/grafanaIt』s detailled running instructions can be found here. But we will go the simple way. Open a new terminal and run:
可以在此处找到详细的运行说明。但我们会走简单的路。打开一个新终端并运行:
docker run -d \
  --network=iot \
  -p 3000:3000 \
  -v $PWD/grafana-data:/var/lib/grafana \
  --name grafana \
  grafana/grafana
The -d option will ask Docker to run the container in detached mode, meaning that after starting the container Docker will let you take back the control of the terminal while keeping the container run in background. You can check that the container is running by listing all running containers:
-d 选项将要求 Docker 在分离模式下运行容器,这意味着在启动容器后,Docker 将允许您收回对终端的控制权,同时保持容器在后台运行。您可以通过列出所有正在运行的容器来检查容器是否正在运行:
docker container lsNow that Grafana started it is listening on http://localhost:3000. Access it with your navigator. The default login infos are: admin / admin. Login and change your password if needed.
现在 Grafana 开始了,它正在听 http://localhost:3000。使用导航器访问它。默认登录信息为:admin / admin。如果需要,请登录并更改密码。
Let』s connect Grafana to InfluxDB. Go to http://localhost:3000/datasources. Add a new data source. In the data source providers options choose InfluxDB. Now, in the form, for the HTTP URL field write: http://influxdb:8086, the InfluxDB location on our Docker iot network. Scroll down, in InfluxDB details, in the database field write: telegraf. Save & test the data source, Grafana should tell you that the data source is working. Houra!
让我们将 Grafana 连接到 InfluxDB。转到 http://localhost:3000/datasources。添加新的数据源。在数据源提供程序选项中,选择 InfluxDB。现在,在表单中,对于 HTTP URL 字段,请写入:http://influxdb:8086,Docker IoT 网络上的 InfluxDB 位置。向下滚动,在 InfluxDB details 中,在数据库字段中写入:telegraf。保存并测试数据源,Grafana应该会告诉您数据源正在工作。霍拉!
Now let』s create a new Grafana dashboard. Head to http://localhost:3000/dashboard/new. From here click the Add new panel button. At the bottom of the screen you will find the query editor. Edit the query:
现在,让我们创建一个新的 Grafana 仪表板。前往 http://localhost:3000/dashboard/new。从这里单击「添加新面板」按钮。在屏幕底部,您将找到查询编辑器。编辑查询:
SELECT last("celsius") FROM "bedroom_temperature" WHERE $timeFilter GROUP BY time($__interval) fill(previous)Use the query you want to view your data. And that』s it. You can now query your InfluxDB database from Grafana. Querying InfluxDB is out of the scope of this article and as such I recommend that you read the documentation.
使用要查看数据的查询。就是这样。您现在可以从 Grafana 查询 InfluxDB 数据库。查询 InfluxDB 超出了本文的讨论范围,因此我建议您阅读文档。
Wrap it up with Docker Compose
用 Docker Compose 完成它
Running all thoses container one by one is a bit tedious. Let me introduce you Docker Compose. Docker Compose is a tool for defining and running multi-container Docker applications. With Compose, you use a YAML file to configure your application』s services. We will create a Docker Compose that will start all our services. The Docker Compose reference can be found here : https://docs.docker.com/compose/compose-file/. Below are the two files you will need to run the stack we talked about during this tutorial.
一个接一个地运行所有这些容器有点乏味。让我向你介绍 Docker Compose。Docker Compose 是用于定义和运行多容器 Docker 应用程序的工具。使用 Compose,您可以使用 YAML 文件来配置应用程序的服务。我们将创建一个 Docker Compose,它将启动我们所有的服务。Docker Compose 参考可以在这里找到:https://docs.docker.com/compose/compose-file/。以下是运行我们在本教程中讨论中所需的三个文件。
docker-compose.yaml
version: "3.8"

services:
  mosquitto:
    image: eclipse-mosquitto:latest
    restart: always
	volumes:
      - ./mosquitto.conf:/mosquitto/config/mosquitto.conf
    ports:
      - "1883:1883"
      - "9001:9001"
    networks:
      - iot

  influxdb:
    image: influxdb:1.8 # 2.0以上需要校验权限了
 	#image: influxdb:latest # 2.0以上需要校验权限了
    restart: always
    ports:
      - "8086:8086"
    networks:
      - iot
    volumes:
      - influxdb-data:/var/lib/influxdb

  telegraf:
    image: telegraf
    restart: always
    volumes:
      - ./telegraf.conf:/etc/telegraf/telegraf.conf:ro
    depends_on:
      - mosquitto
      - influxdb
    networks:
      - iot

  grafana:
    image: grafana/grafana
    restart: always
    ports:
      - "3000:3000"
    networks:
      - iot
    volumes:
      - grafana-data:/var/lib/grafana
    depends_on:
      - influxdb

networks:
  iot:

volumes:
  influxdb-data:
  grafana-data:
telegraf.conf ( influxdb:1.8 的配置)
[[outputs.influxdb]]
  urls = ["http://influxdb:8086"]

[[outputs.file]]
  files = ["stdout", "/tmp/metrics.out"]

[[inputs.mqtt_consumer]]
  servers = ["tcp://mosquitto:1883"]
  topics = [
    "bedroom/#"
  ]
telegraf.conf ( influxdb:2.0 的配置)
[[outputs.influxdb_v2]]

  urls = ["http://xx.xx.xx.xx:8086"]

  ## API token for authentication.
  token = "xxxxxx"
  ## Organization is the name of the organization you wish to write to; must exist.
  organization = "Grafana1"

  ## Destination bucket to write into.
  bucket = "Grafana1"

[[outputs.file]]
  files = ["stdout", "/tmp/metrics.out"]

[[outputs.file]]
  files = ["stdout", "/tmp/metrics.out"]

[[inputs.mqtt_consumer]]
  servers = ["tcp://mosquitto:1883"]
  data_format = "json"
  json_name_key = "temperature"
  topics = [
    "bedroom/#",
    "thingsBoard/#"
  ]

[agent]
  debug = true
mosquitto.conf
listener 1883
allow_anonymous true

listener 9001
allow_anonymous true
To run the stack, in the folder where thoses two files are, run the following command:
要运行堆栈,请在这两个文件所在的文件夹中运行以下命令:
docker-compose up -dThis will start all Docker Compose service in detached mode (-d). You should now be able to go to Grafana on http://localhost:3000. Also, you should be able to send MQTT message with:
这将以分离模式 (-d) 启动所有 Docker Compose 服务。您现在应该可以在 http://localhost:3000 去格拉法纳。此外,您应该能够使用以下命令发送 MQTT 消息:
docker container exec mosquitto mosquitto_pub \
  -t 'bedroom/temperature' \
  -m 'bedroom_temperature celsius=20'
Replace mosquitto with the name of your running container, which should be something like folder_name_mosquitto_1. If you want to stop all your containers:
将 mosquitto 替换为正在运行的容器的名称,该名称应类似于 folder_name_mosquitto_1。如果要停止所有容器:
docker-compose stopAnd that』s it for this tutorial. We have seen how to setup a complete tech stack for handling a large amount of data using state of the art technologies.
本教程就到此为止。我们已经了解了如何使用最先进的技术设置完整的技术堆栈来处理大量数据。